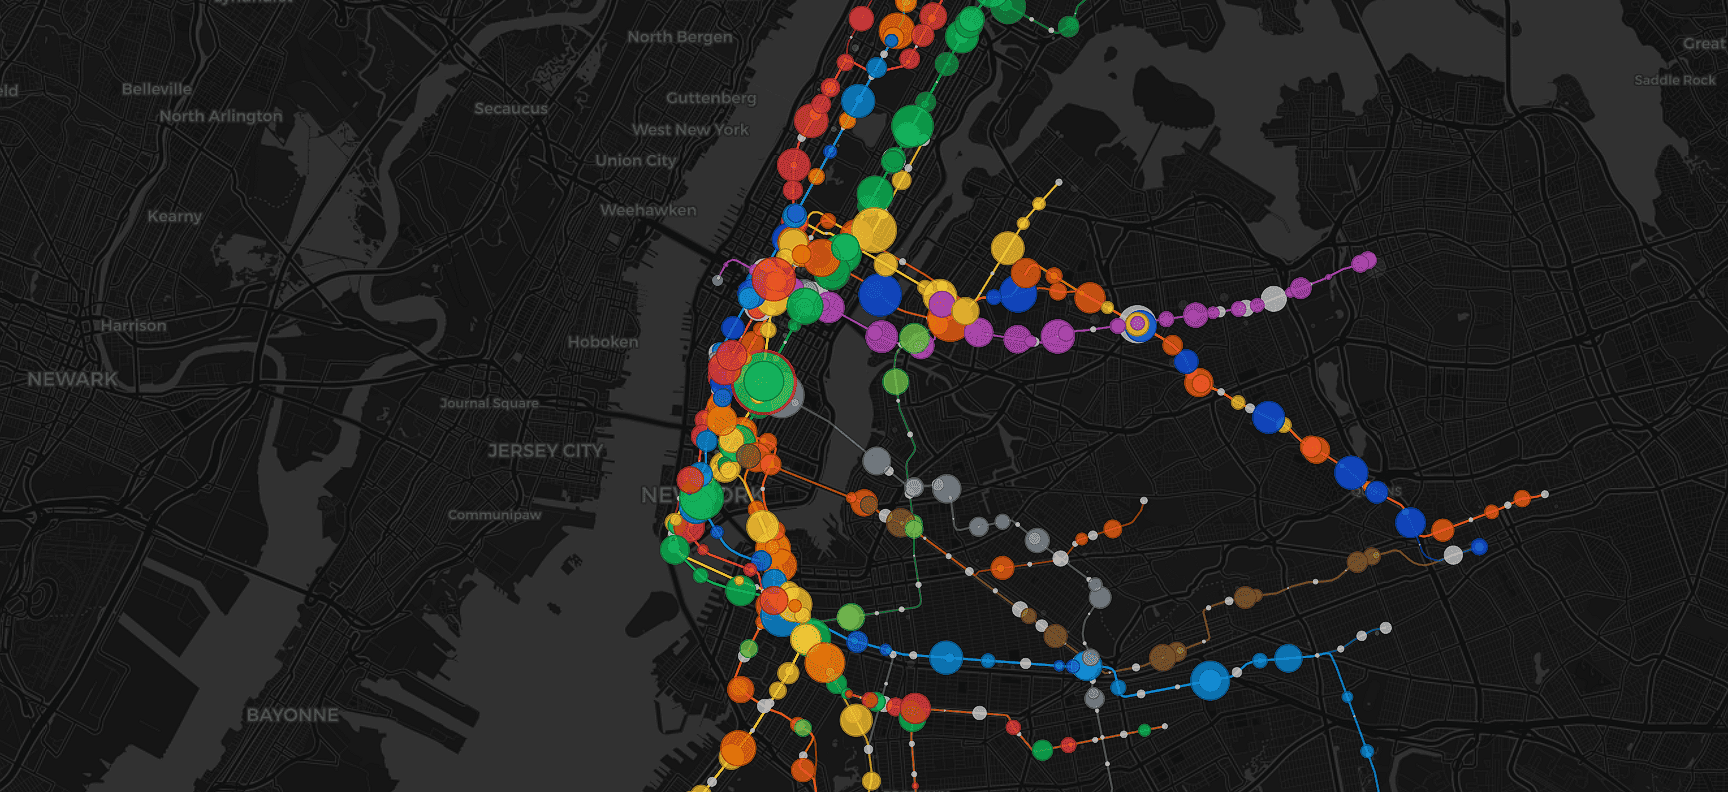
A beautiful visualization of New York City subway traffic in September 2025.
The author of the project used an average Wednesday, during which 4.3 million trips were made. The size of each “bubble” on the map is proportional to the number of passengers on a specific train.
Interestingly, all routes are “inferred” by algorithms based on hourly estimates of passenger flow between origin and destination stations, as well as train schedules published by the MTA.
View the website: anita.garden/nycriders/